À propos de BACIE Tchad

Nous sommes un bureau d'analyses et de conseils spécialisés en intelligence économique, offrant des solutions adaptées aux besoins de nos clients.

Dans un contexte de bouleversement total des économies, et qu’où l’on assiste actuellement à des dégâts dans cette guerre économique impitoyable (Chômage de masse, suicides de salariés, faillite d’entreprises, fermeture d’usines, délocalisations, perte de puissance, perte de compétitivité), il appartient aux hommes et aux femmes dynamiques de faire usage de leur compétence et de leur intelligence pour apporter leur contribution à la reconstruction de ces économies.

Cette reconstruction passe par l’usage des principes et méthodes adaptés qui aboutissent à des solutions concrètes. C’est ainsi que le BACIE s’est inscrit dans ce contexte pour mettre à la disposition des décideurs notre expertise et notre capacité à apporter des solutions idoines pour le développement de leurs projets.

A laptop displaying a stock market graph is placed on a large wooden conference table in a room with tall windows letting in natural light. The room features a minimal design with neutral tones and a ceiling mounted fluorescent light fixture.
A digital dashboard displaying various analytics charts and graphs. There is a line graph showing user engagement over time on the left, a section with total revenue marked as $74K, and bar charts illustrating user statistics by region. The central section highlights users in the last 30 minutes, focusing on different countries such as the United States, Canada, India, Pakistan, and Brazil.
A computer screen displaying a data analytics dashboard with graphs and charts. A blue line graph shows fluctuations in data over time, and a section highlights the number of page views. A pie chart is partially visible, indicating a breakdown of different data elements.

Notre expertise

Avec une équipe d'experts, nous fournissons des analyses approfondies pour aider les entreprises à naviguer dans un environnement économique complexe.
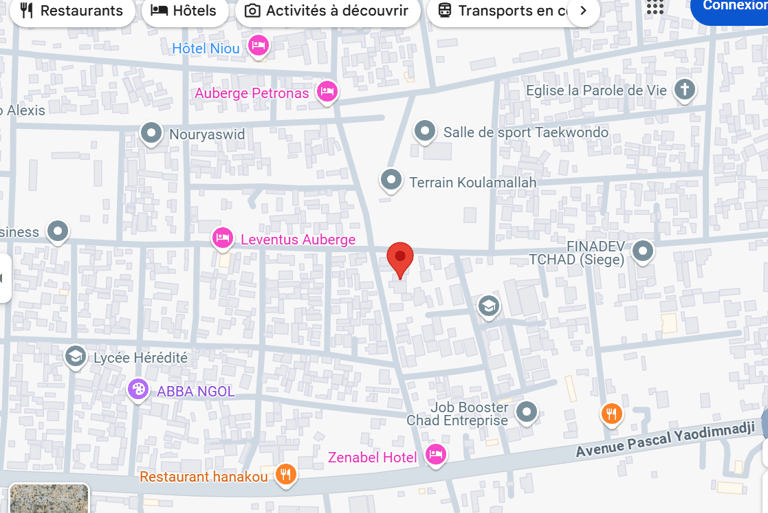
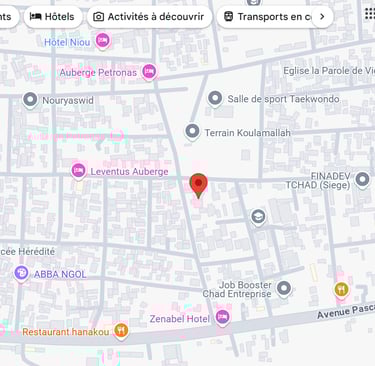
Notre Localisation

Nous sommes situés au cœur de la ville, offrant des services d'analyses et de conseils en intelligence économique.

Adresse

Quartier Habbena BP 353 N'Djamena-Tchad

Heures

08h à 17h

Jour

Lundi au Samedi

Les analyses de Bacietchad ont transformé notre stratégie économique. Leur expertise en intelligence économique est inestimable pour notre croissance. Je recommande vivement leurs services.

Malaria consortium

★★★★★